
Bitcoin Price Chart: A Window into Market Sentiment
Bitcoin, the world’s first cryptocurrency, has become synonymous with price charts that capture the imagination of traders, investors, and curious onlookers. A Bitcoin price chart isn’t just a line on a screen. it’s a story of supply and demand, macroeconomic influences, and evolving technology. Here’s a concise, 500-word overview with clear headlines to help you understand what those charts are telling us.
What a Bitcoin Price Chart Shows
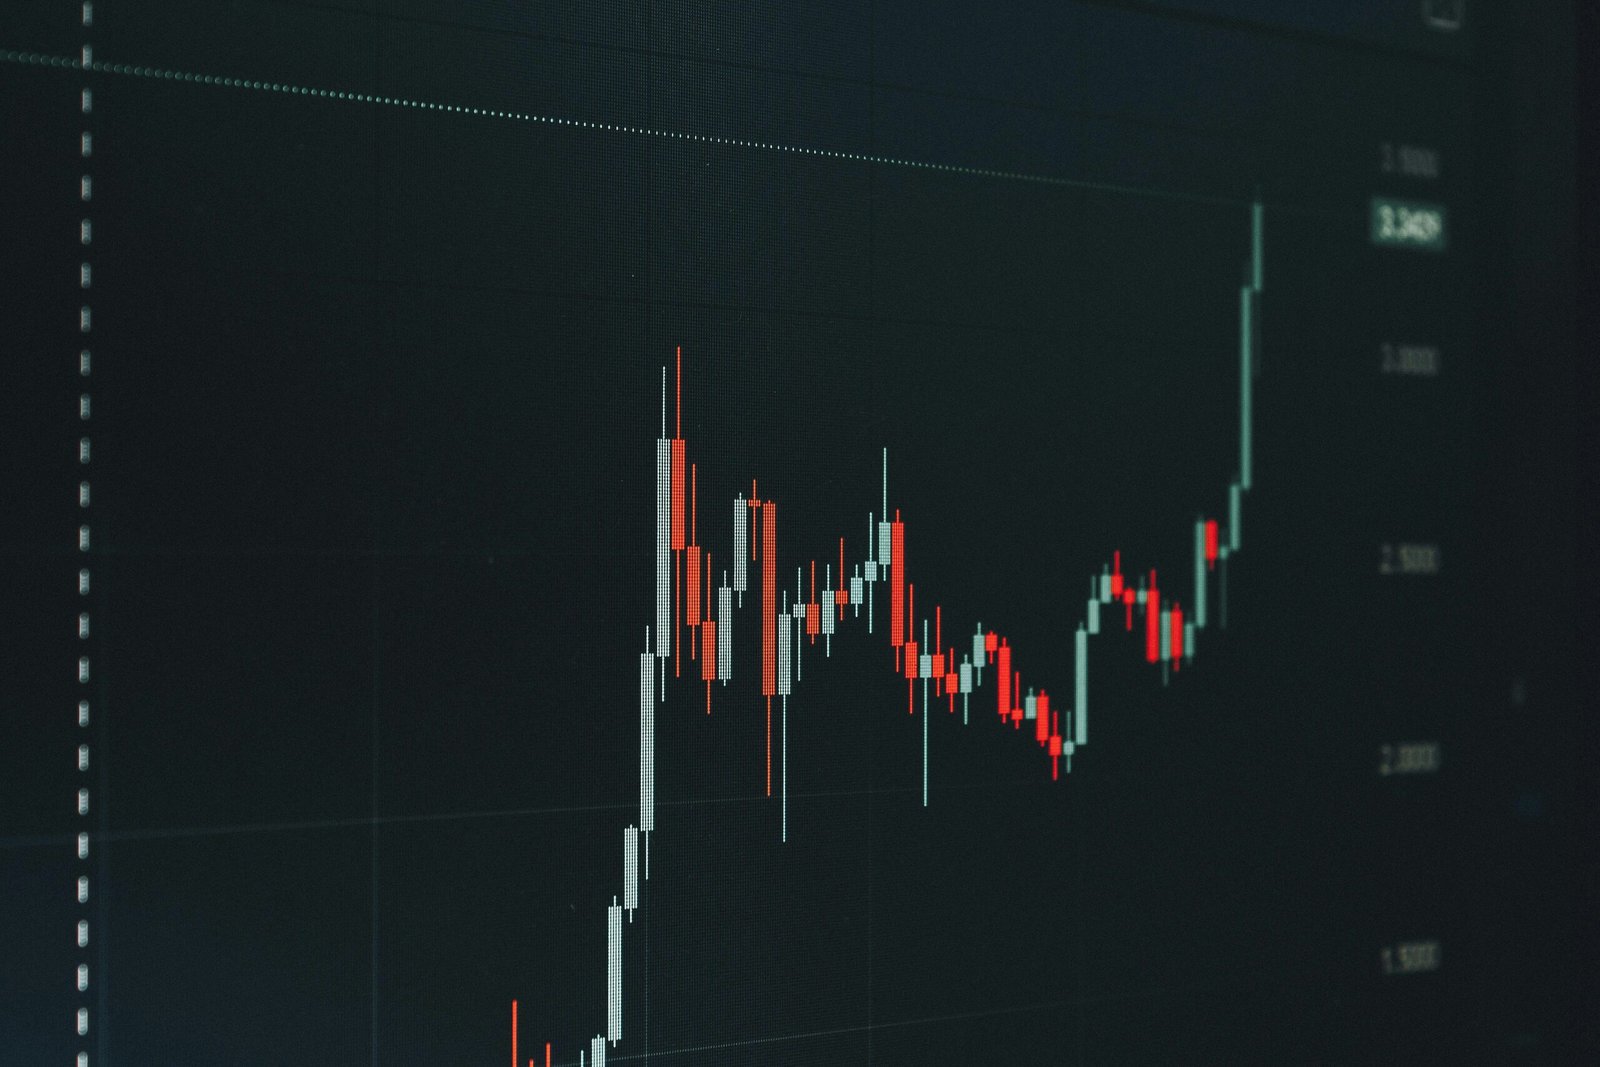
A price chart maps the value of Bitcoin over time. Common formats include line charts, candlestick charts, and OHLC (open-high-low-close) bars. Each format reveals different details:
- Line charts: A simple trajectory of closing prices, useful for spotting broad trends.
- Candlestick charts: Daily intervals with four data points (open, high, low, close) that illuminate momentum and volatility.
- OHLC bars: Similar to candlesticks. They are often preferred by traditional traders for quick visual cues.
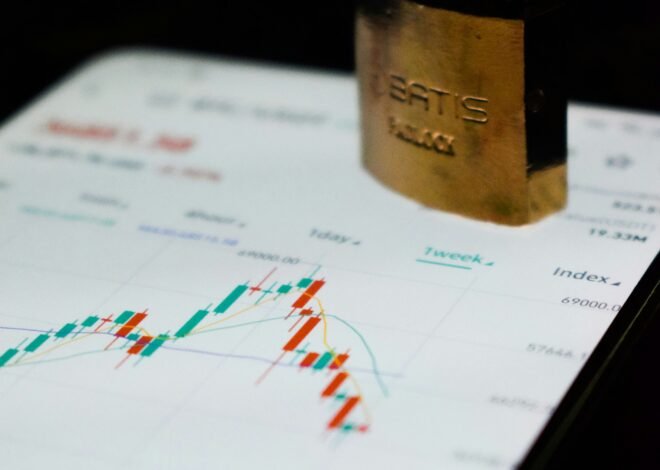
Beyond price, charts may include traded volume, moving averages, and indicators like the Relative Strength Index (RSI) or MACD. These overlays help traders gauge momentum, trend strength, and potential reversal points.
Key Phases in Bitcoin’s Price History
Bitcoin’s price has cycled through several recognizable phases:
- Early Foundation (2009-2012): Slow, experimental adoption with significant volatility.
- Growth and Hype (2013-2017): Rapid appreciation, culminating in a dramatic surge followed by pronounced corrections.
- Institutional Attention (2019-2021): Greater participation from institutions, ETFs, and asset managers; sharp rallies and dramatic highs.
- Maturation and Volatility (2022-2024): Periods of consolidation, macro-driven moves, and evolving macro correlations.
- Evolving Regime (2025-): As adoption broadens, price action often reflects a mix of macro drivers, on-chain metrics, and narrative shifts.
Charts visually encode these regimes as trends, breakouts, and pullbacks. Long uptrends appear as series of higher highs and higher lows; downtrends show lower highs and lower lows. Range-bound periods feature horizontal price action with occasional spikes.
What Drives Bitcoin’s Price Movements?
No single factor governs Bitcoin’s price. Multiple forces influence it. A confluence of elements shapes the chart:
- Macroeconomics: Inflation, interest rates, and dollar strength influence risk appetite and store-of-value narratives.
- Hedging and Diversification: Investors view Bitcoin as a potential alternative to traditional assets.
- Adoption Milestones: Layer-2 scalability, institutional custody, and regulatory clarity can spark bullish moves.
- Market Structure: Liquidity, exchange flows, and futures markets affect volatility and trend persistence.
- On-Chain Activity: Network fundamentals—hash rate, transaction volume, and wallet activity—can foreshadow shifts in sentiment.
Reading Trends and Signals
Smart chart interpretation blends price patterns with indicators:
- Trend lines: Drawn along swing highs or lows, they identify support and resistance levels.
- Moving Averages: The 50-day and 200-day averages help smooth data and indicate momentum shifts; crossovers can signal potential entries or exits.
- RSI and MACD: RSI above 70 may indicate overbought conditions; below 30 may suggest oversold. MACD crossovers can hint at changing momentum.
- Volume: Rising volume on up days confirms strength; declining volume on advances may warn of a weakening trend.
Caution for New Investors
Bitcoin’s price history is a reminder that high rewards often come with high risk. Rapid rallies can reverse violently, and periods of calm can end abruptly. Diversification, risk management, and a clear plan for entry, position sizing, and exit are essential. Always consider your time horizon, liquidity needs, and how Bitcoin fits into a broader investment strategy.
The Takeaway
A Bitcoin price chart it helps traders understand market trends. It’s a dynamic tool that reflects market psychology, macro developments, and technological progress. By reading trends, understanding drivers, and applying disciplined risk controls, traders and observers can extract meaningful insights from the charts without succumbing to hype. As adoption evolves and markets mature, the charts will continue to tell an evolving story about value, risk, and the future of digital money.
Related Posts

Blockchain Security: How Blockchain Protects Data
How Blockchain Technology Is Reshaping Finance